Hi, what are you looking for?
Alabama Political Reporter
- Elections
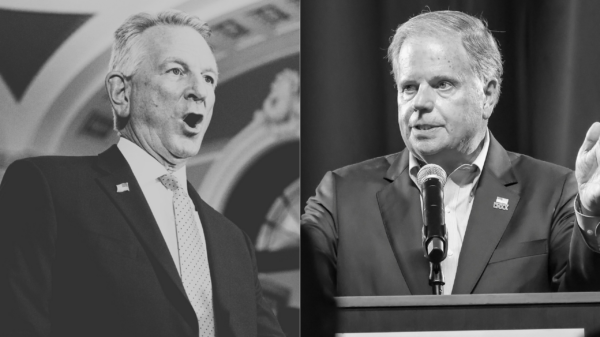
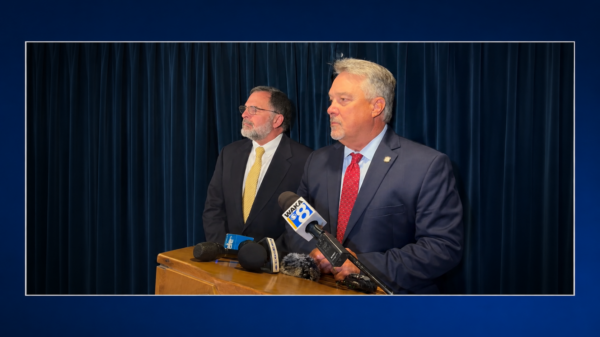
Doug Jones, Tuberville allies react to residency case dismissal
Tuberville residency fight unresolved as voters plan appeal

Opinion | 99 problems, but the pledge ain’t one
Alabama Democratic Party convenes to reorganize August 8
GUMBO endorses Jerry Carl’s campaign to represent 1st Congressional District
- Governor

Governor issues flag-lowering directive for Firefighter Sydney Kathryne Watson
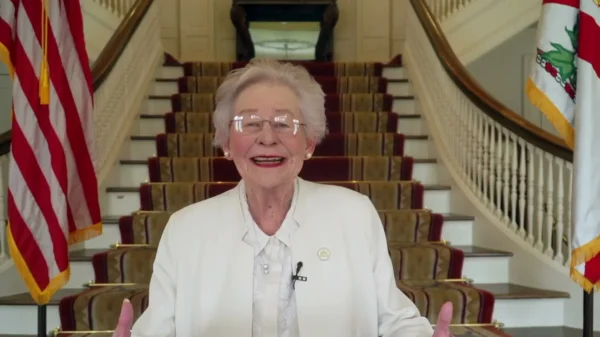
Gov. Ivey marks America’s 250th birthday with Fourth of July message

Gov. Ivey awards more than $6.3M for weatherization assistance

Alabama joins Great American State Fair for America’s 250th

Ivey names new members to STEM Council leadership
- Legislature
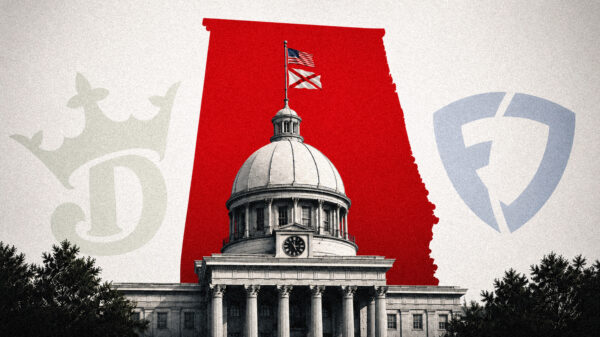
DraftKings, FanDuel-backed PAC scores big wins in Alabama primaries

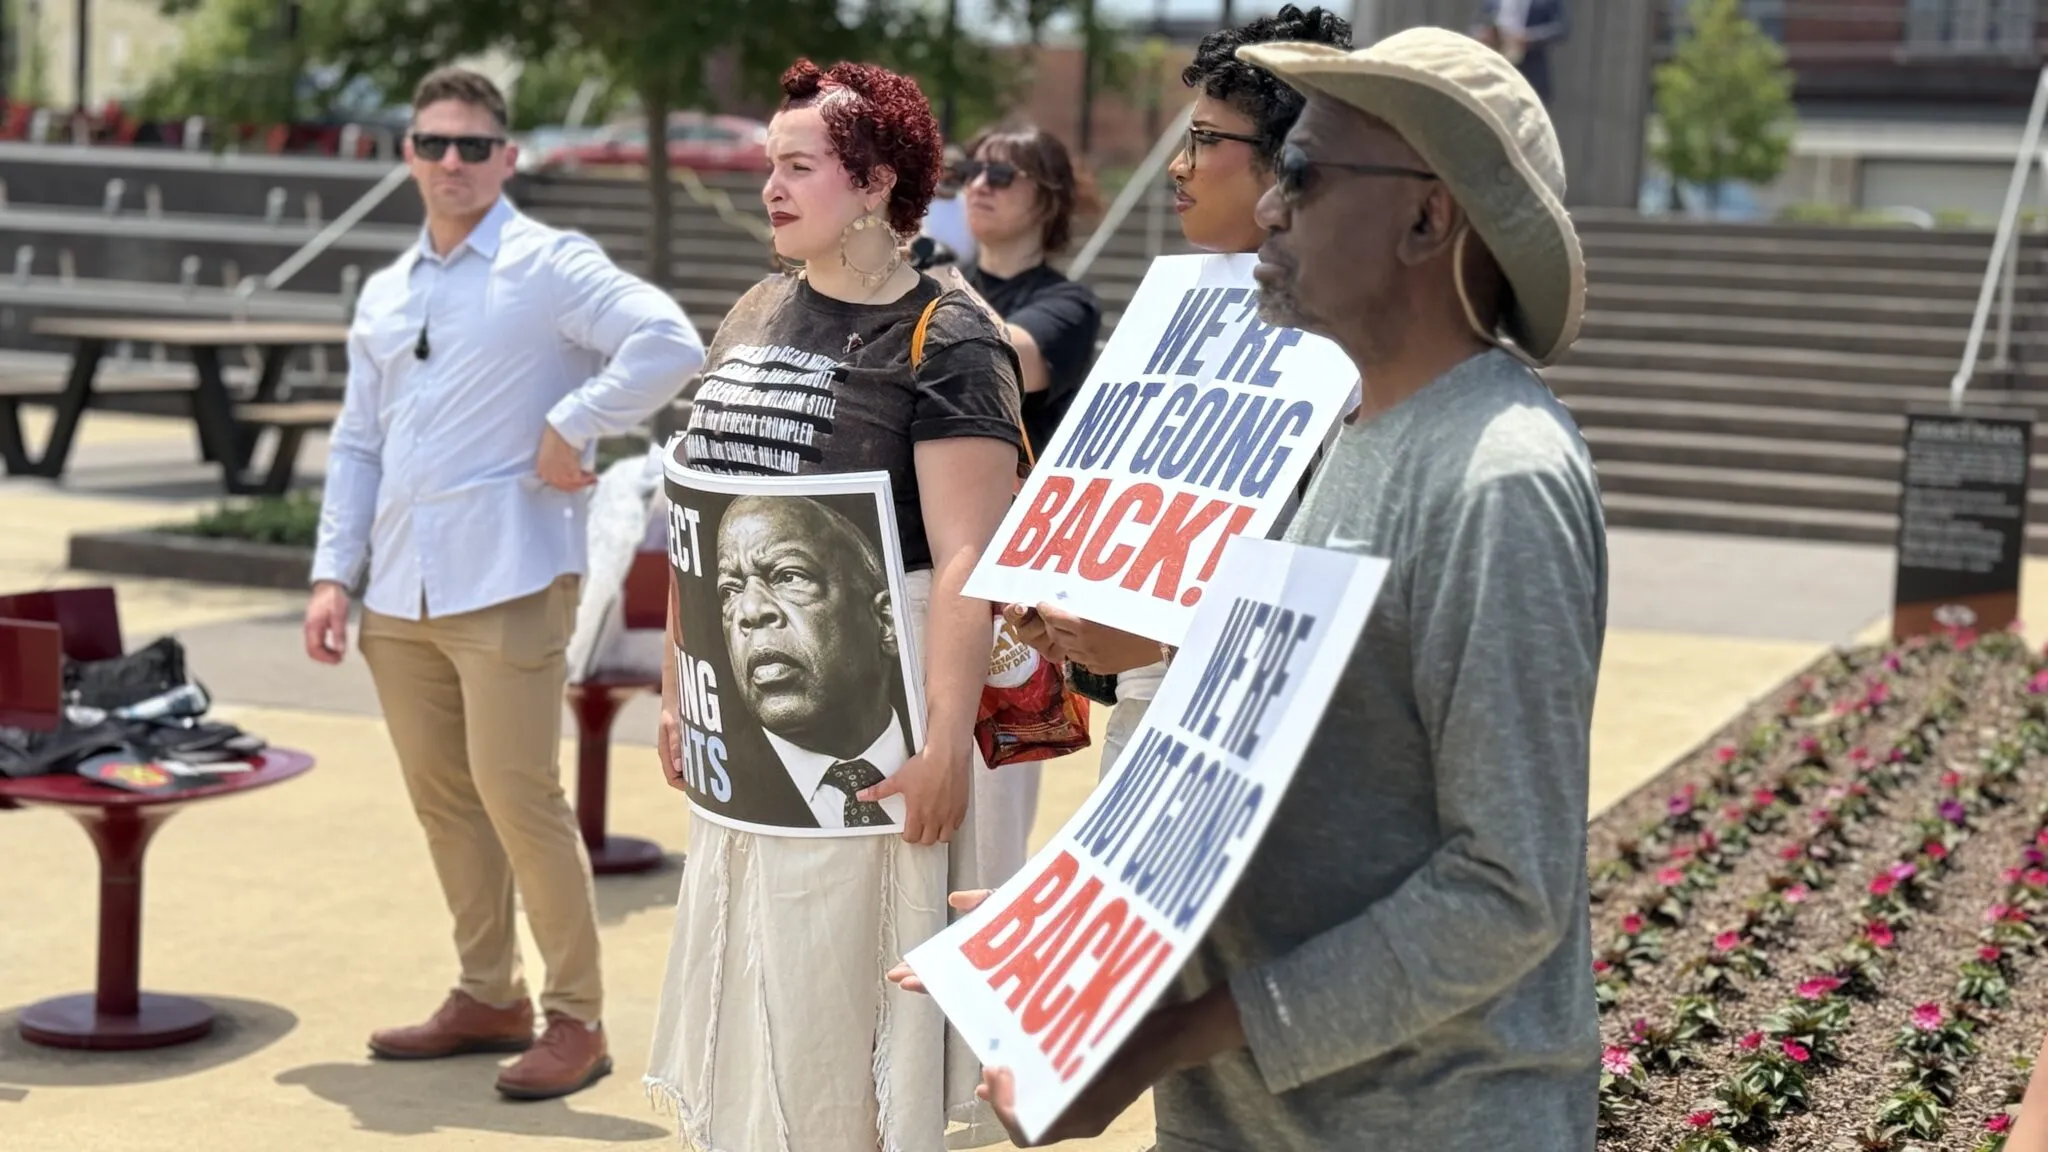
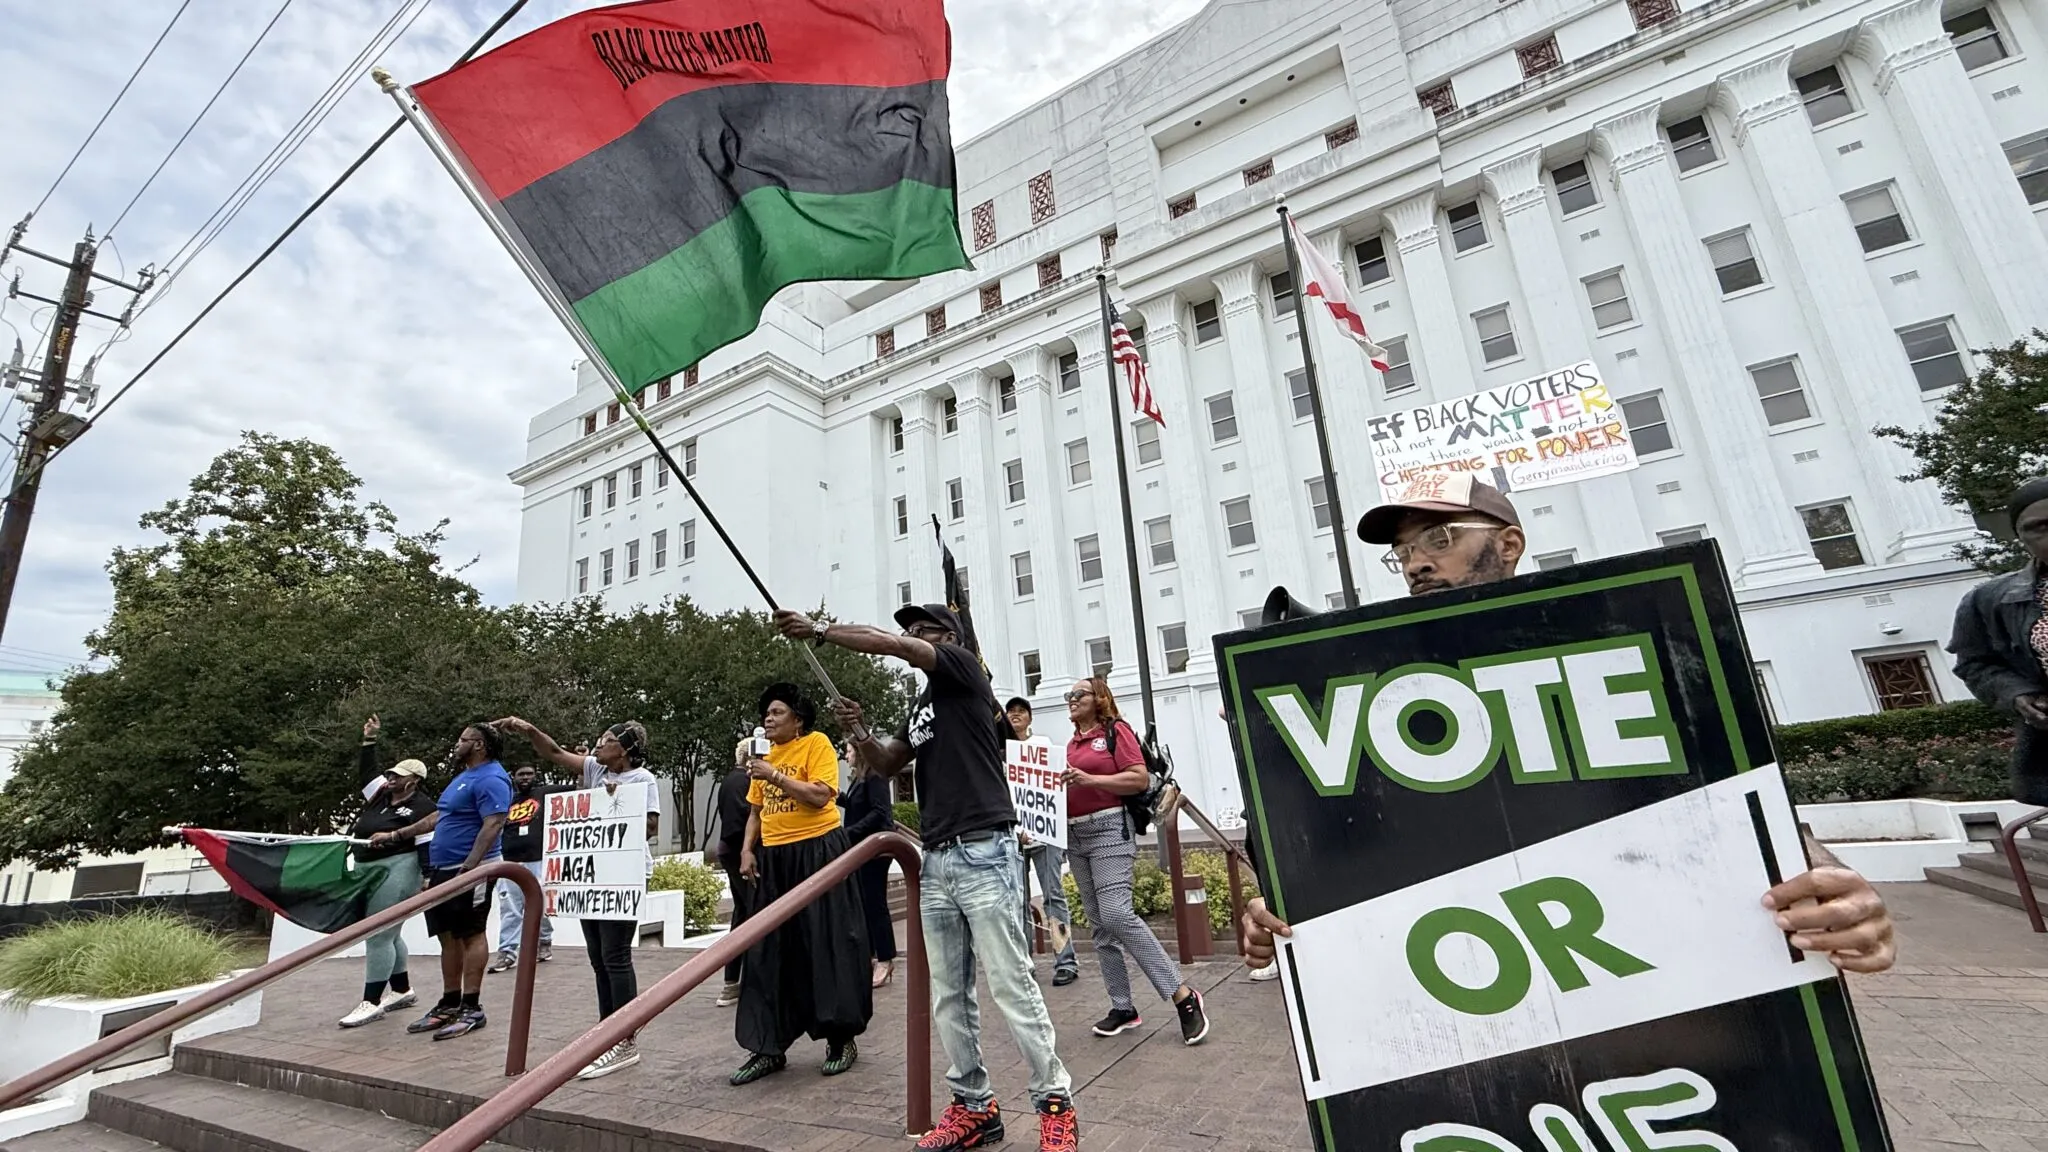
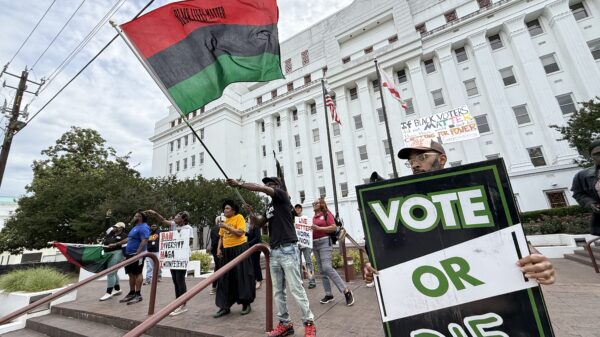
“Brawling for our Vote”: Thousands rally to protect Black voting power in the South
Full exchange undercuts claims Ledbetter called for ending 14th Amendment
ACLU vows to take Alabama to court over special session bills

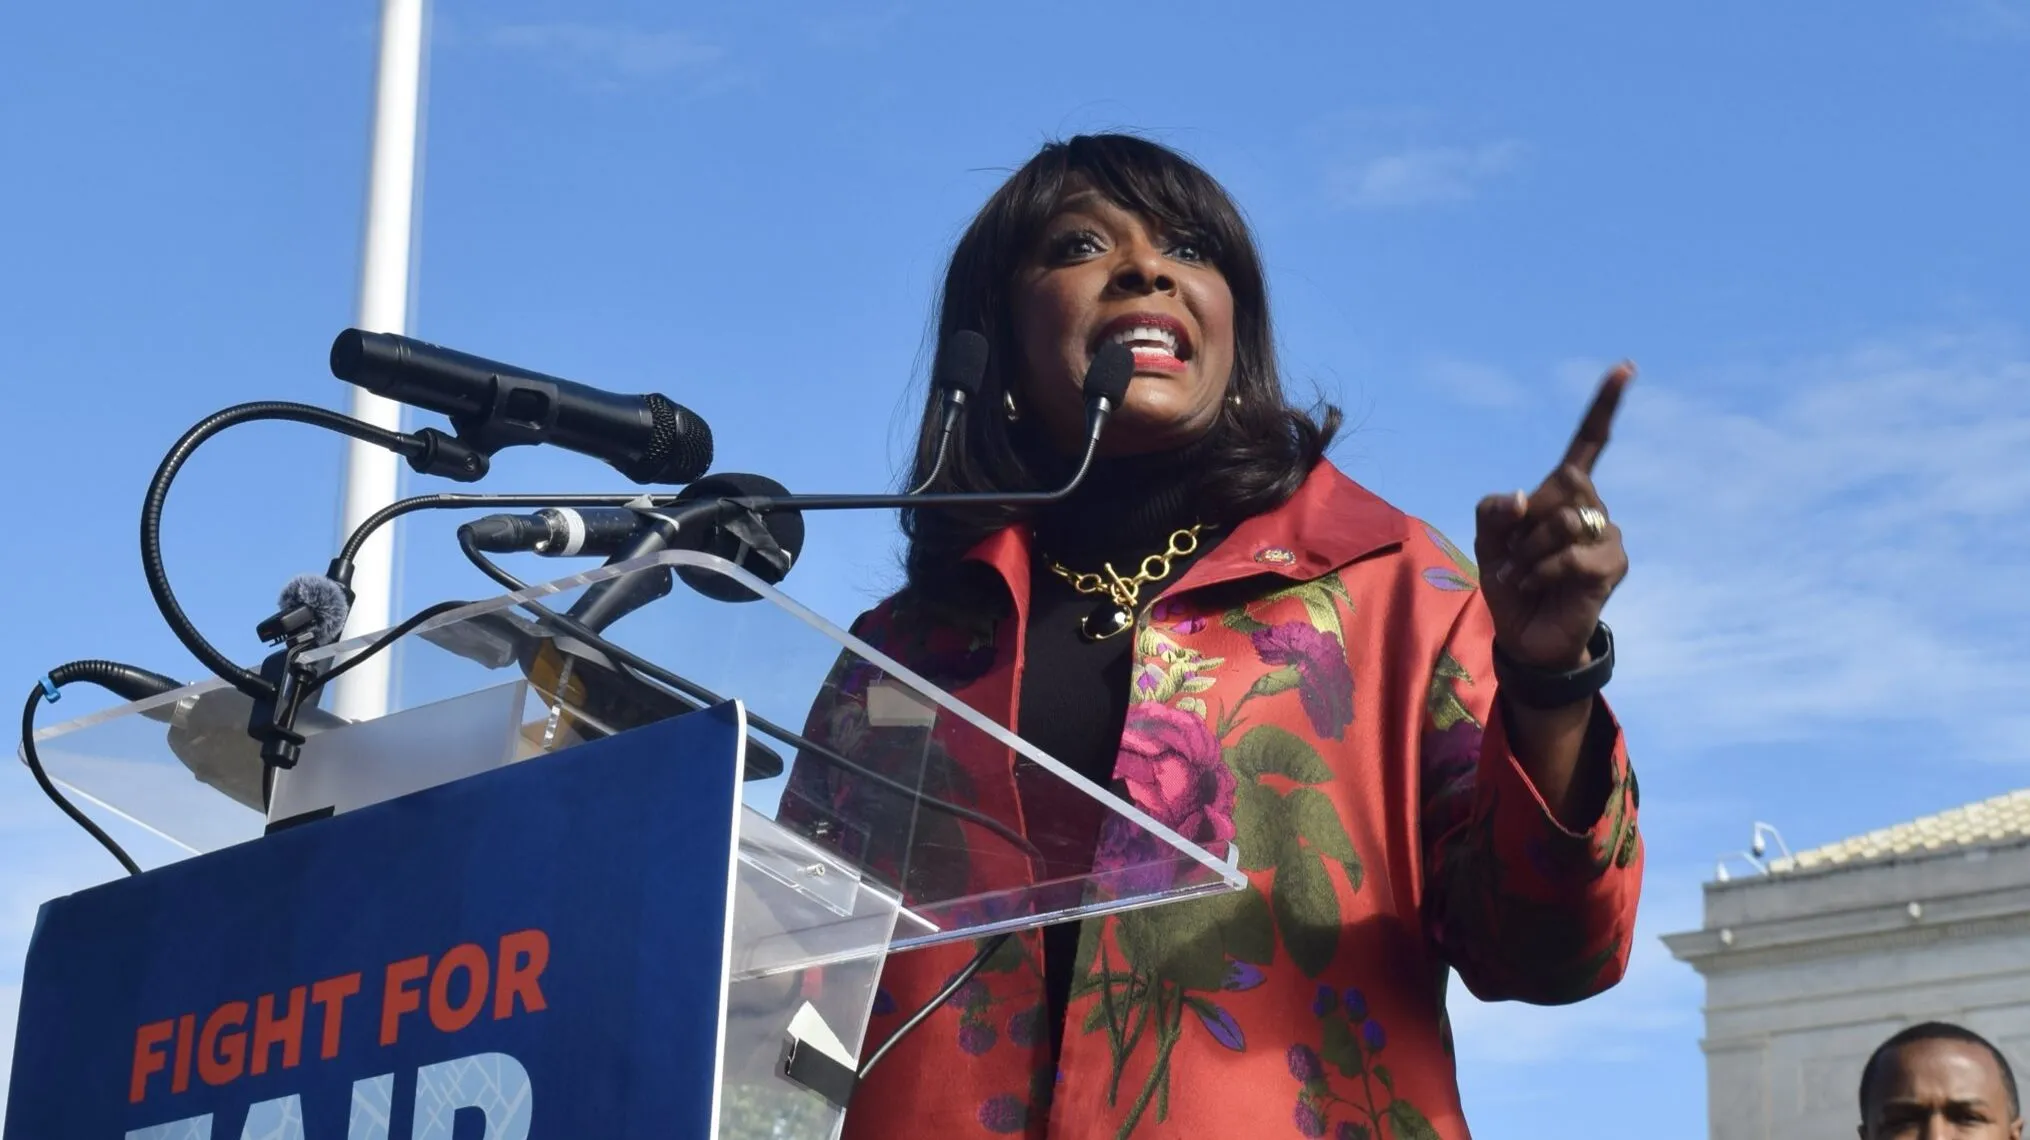
Terri Sewell condemns Alabama redistricting election law
- Economy

Opinion | Mobile deserves more than promises before rail merger

Opinion | Experience has taught me to be skeptical of big promises
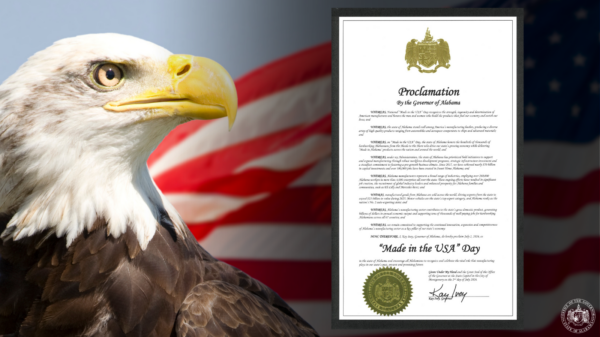
Ivey signs “Made in the USA” Day proclamation celebrating Alabama manufacturers

National Federation of Independent Business releases June Jobs Report
Alabama launches Workforce Pell for short-term job training
- National

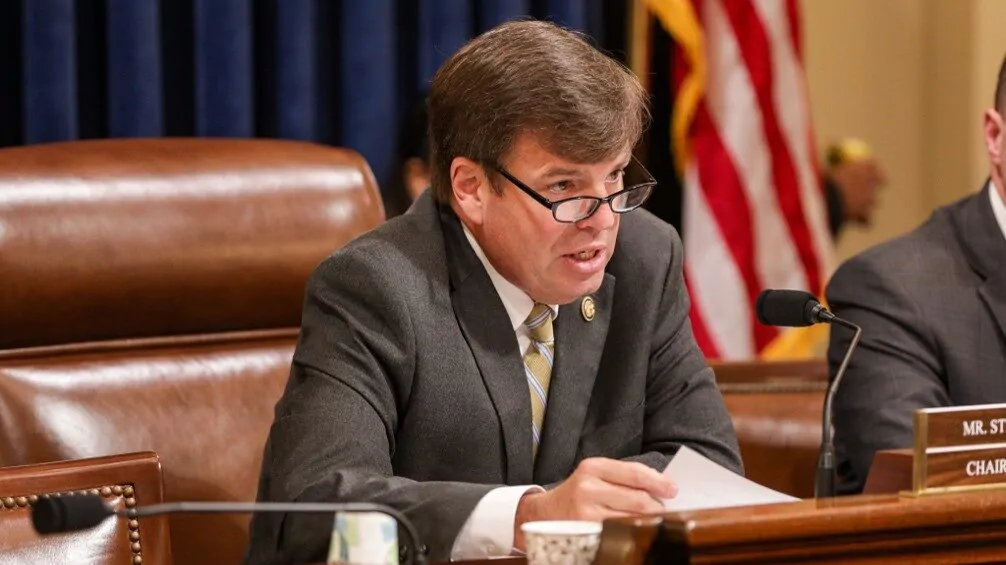
Rep. Dale Strong announces appointment of 21 North Alabama students to US service academies
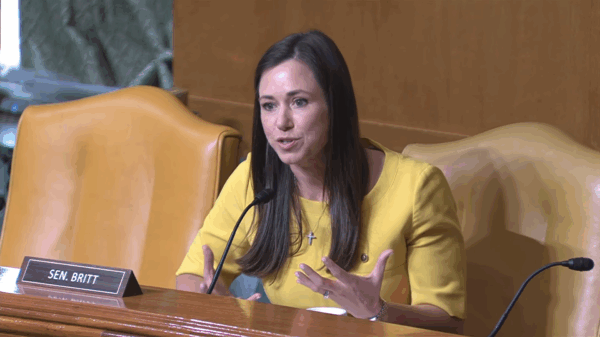
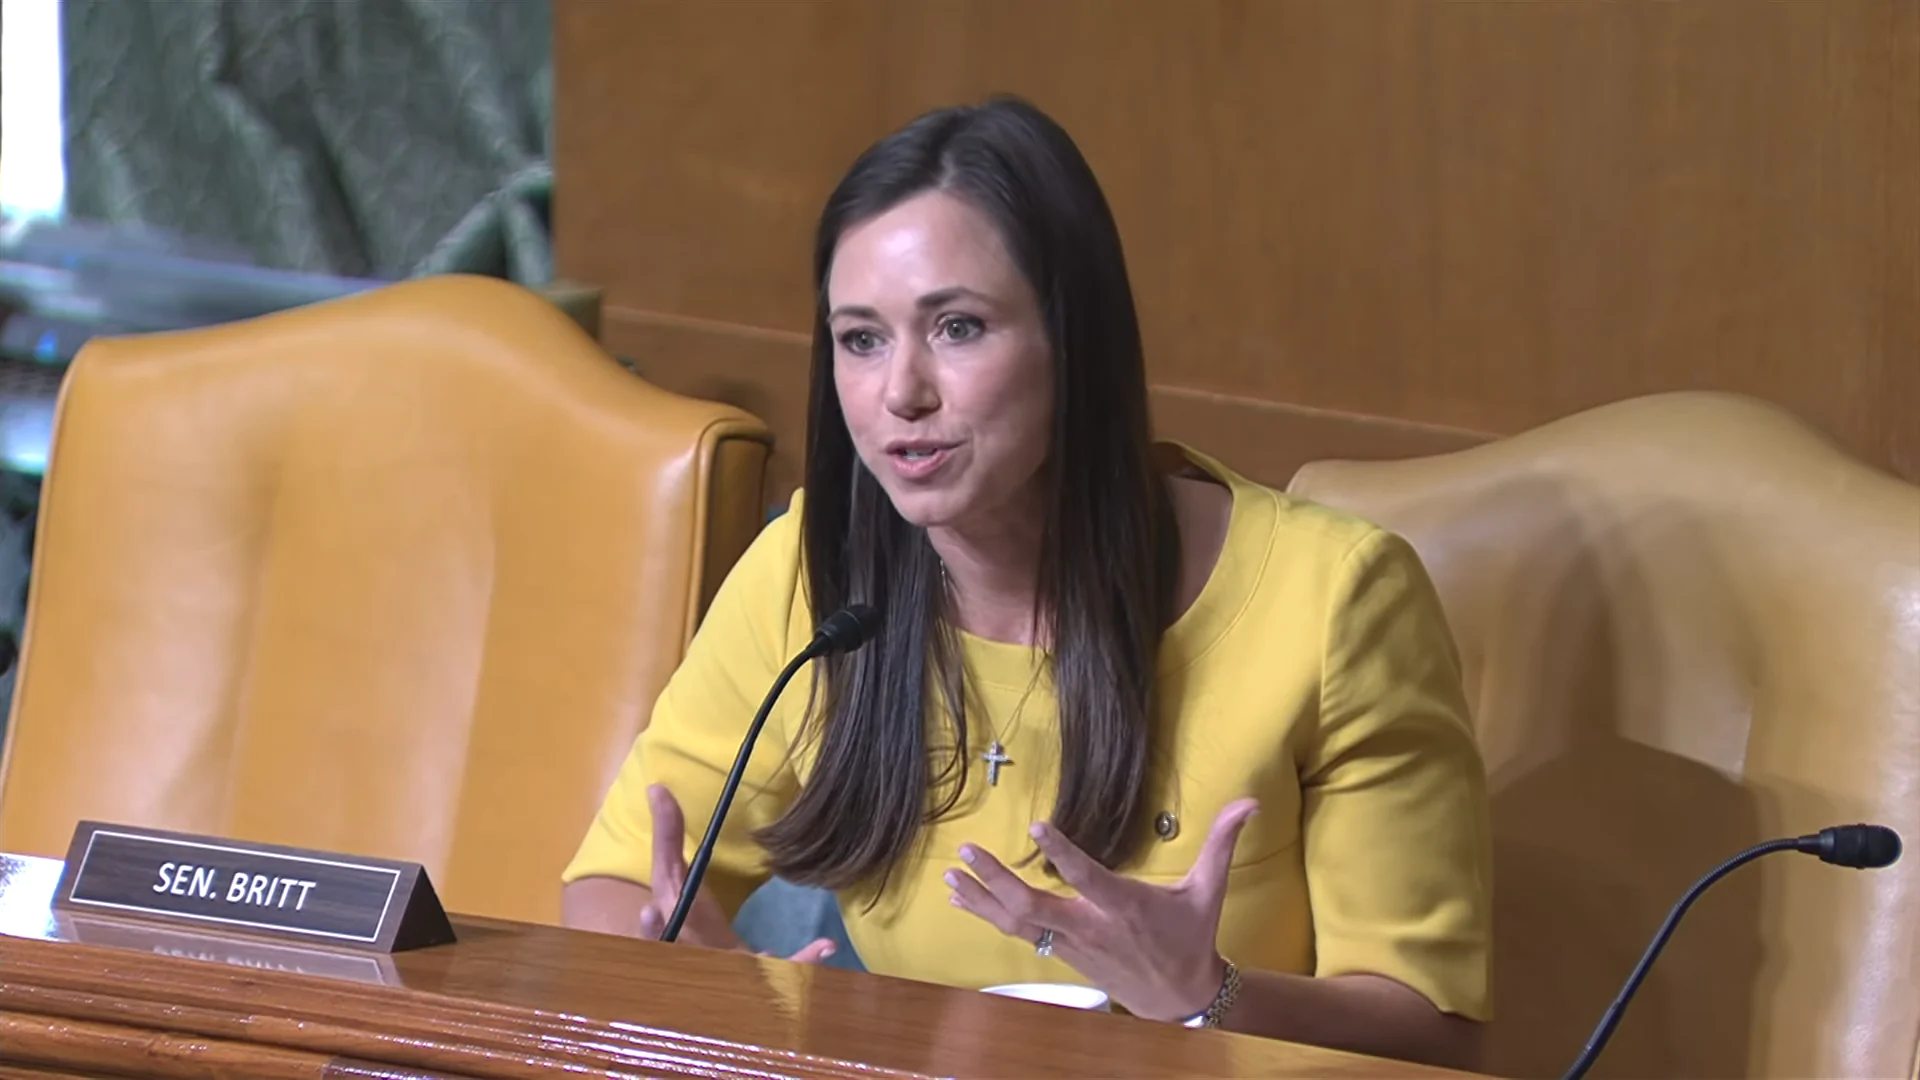
Sen. Britt attends leadership nomination hearing
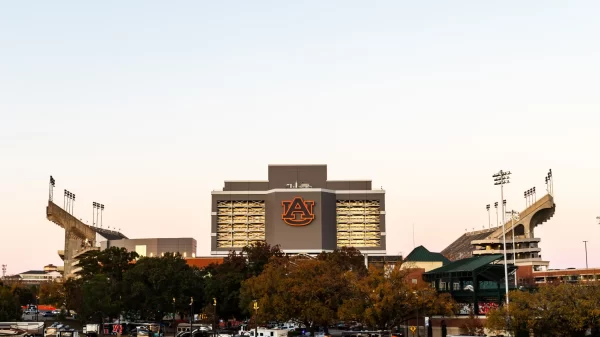
Alabama, Auburn oppose Protect College Sports Act

Rep. Dale Strong promotes bill to mandate Pledge of Allegiance in public schools during Newsmax appearance

Rep. Sewell announces July 2026 mobile office hours
- Education
Alabama Community College Systems discusses new adult education workforce model
Chad Holden takes helm of Alabama Association of School Boards

Huntingdon College names six new trustees to board

Alabama Commission on Higher Education advances scholarship, grant rule changes

Former UAB vice president leads $2.8 million NSF grant to develop research administration curriculum
- Health

UAB receives $4 million to expand Live HealthSmart Alabama initiative
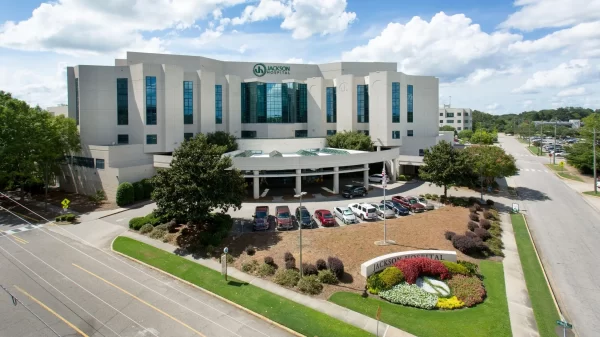
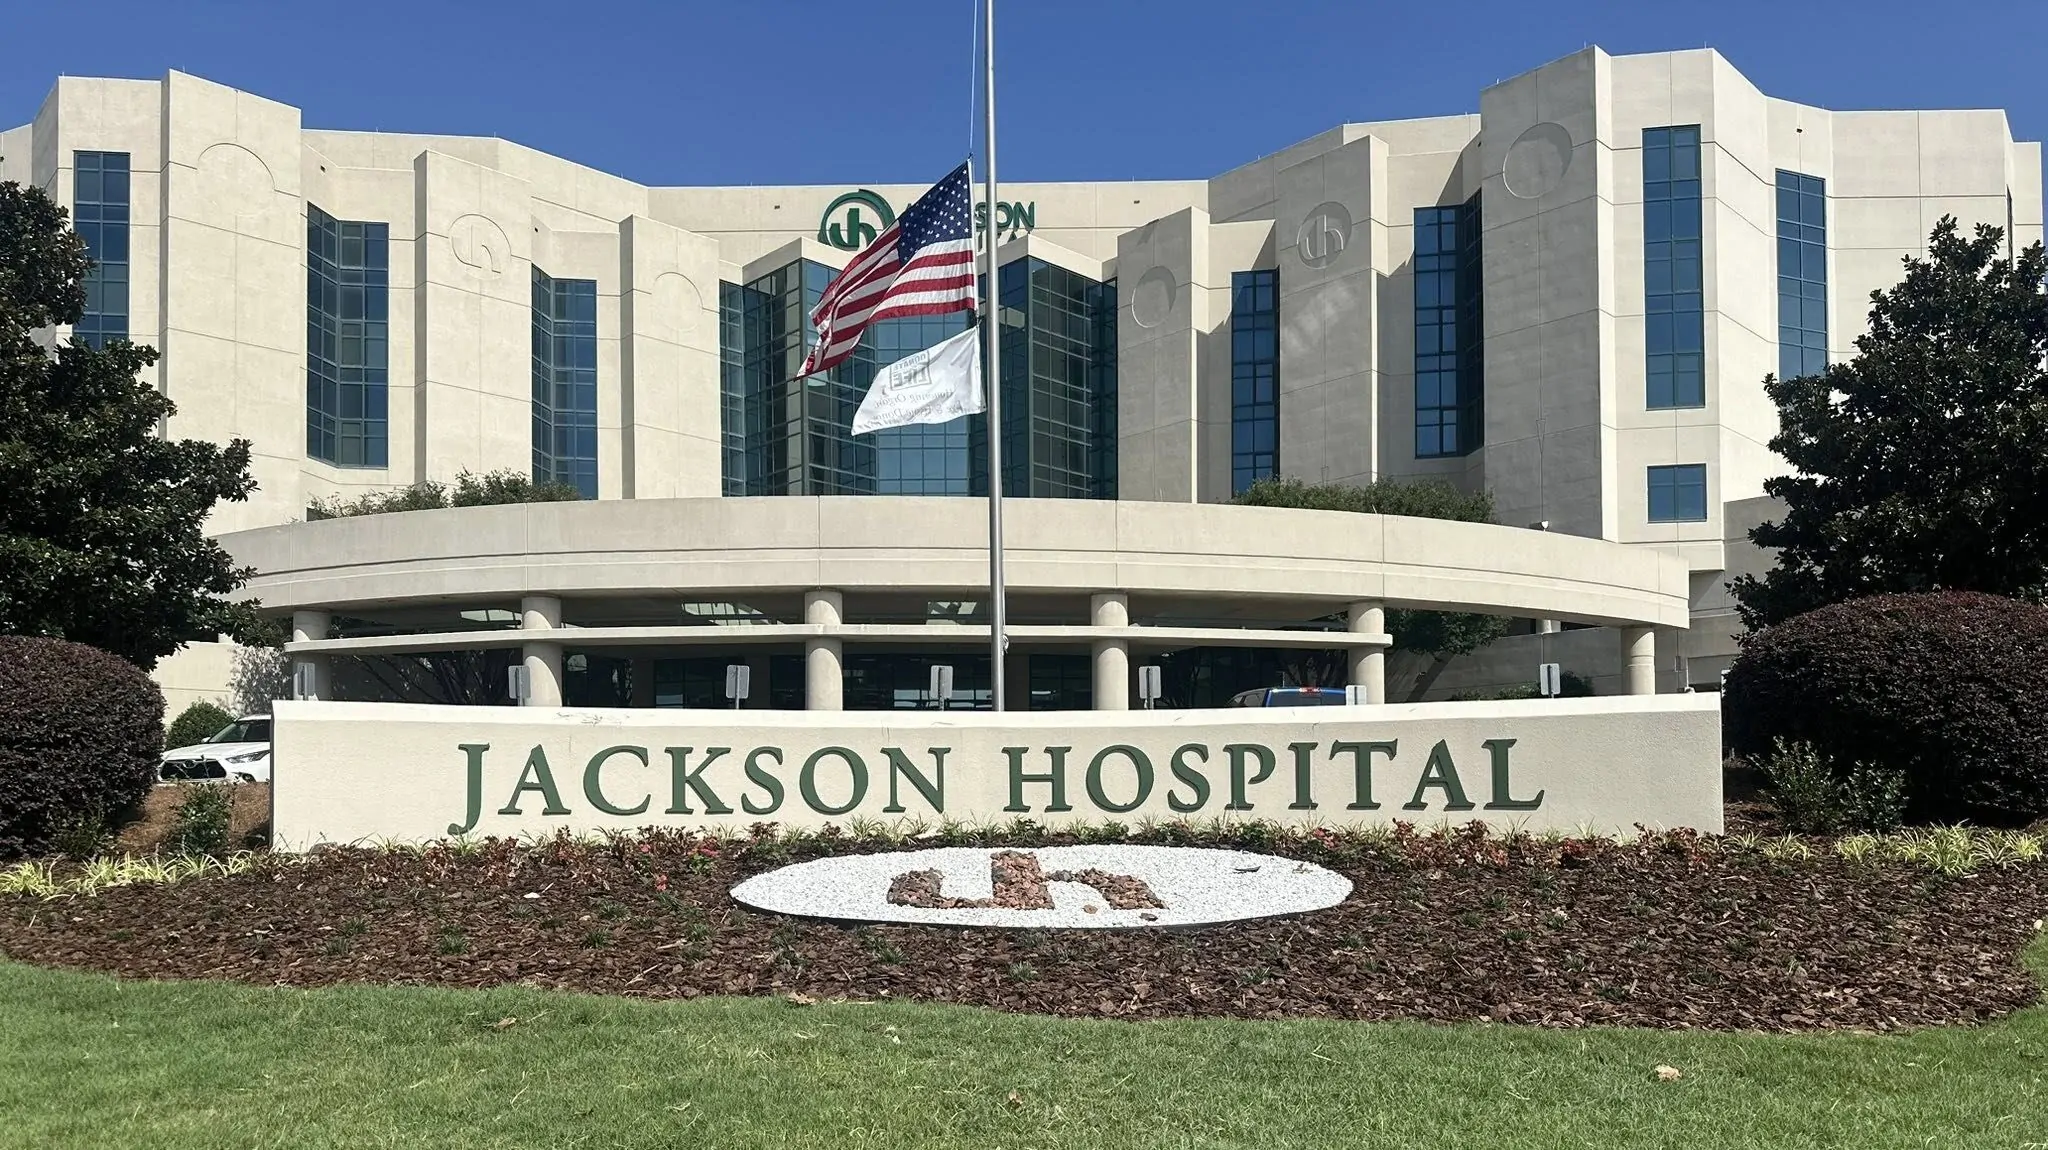
Jackson Hospital to remain open for now as officials pursue rescue plan
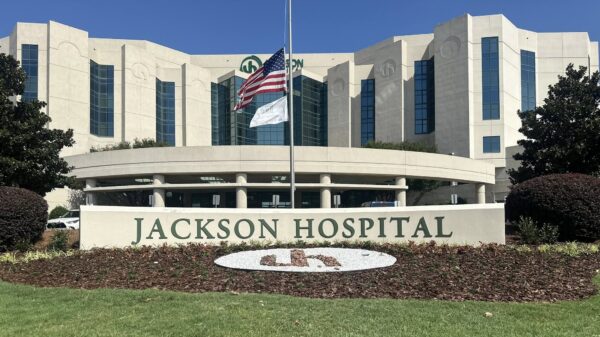
Jackson Hospital delays closure announcement as questions mount over future
Jeff Samz elected chair of Alabama Hospital Association board

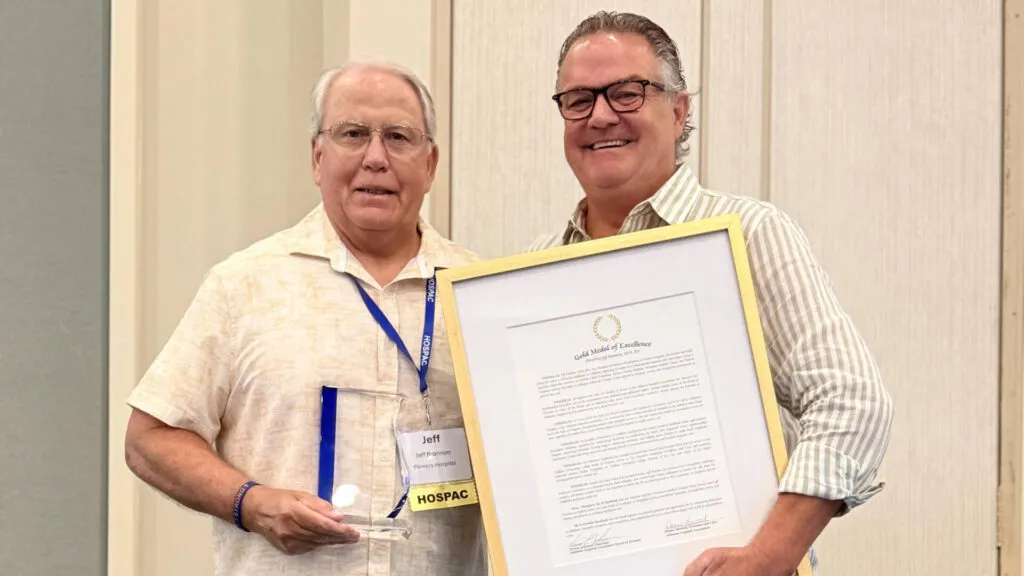
Flowers Hospital’s Jeff Brannon receives Gold Medal of Excellence award
- Opinion