By Bill and Susan Britt
Alabama Political Reporter
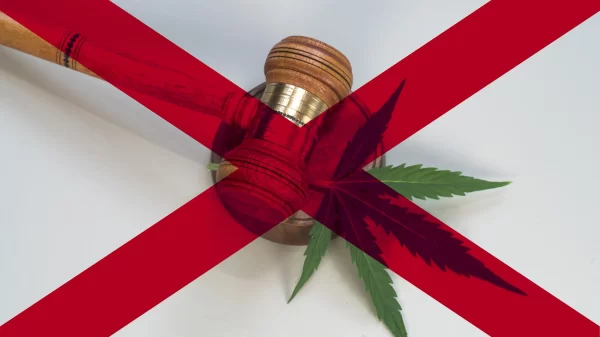
MONTGOMERY—Republican candidates spent almost $12,000,000 in the primary elections for the Alabama House and Senate, not including millions in “dark money.”
On average, the top ten spenders for House seats paid out 101.02 per vote, while in the top ten Senate moneyed races, candidates paid on average $46.98 for each vote.
Speaker of the House Mike Hubbard, R-Auburn, ran the most extravagant campaign spending $304.28 per vote. Hubbard, spent almost twice as much for his votes than any other House or Senate Candidate. His challenger for House District 79, Sandy Toomer, came in third biggest spender in the House paying $145.28. per vote.
Hubbard, outspent all House or Senate candidates with $896,700.32 paid out for under 3000 vote. (Of this amount Hubbard spent almost $300,000 with his own companies.)
Sen. Tom Whatley, R-Auburn, was the biggest spender in the Senate, paying $72.92 per vote in his bid to retain his seat. Coming in right behind Whatley was Sen. Gerald Dial, R-Lineville, who laid out $64.11 for each vote, to narrowly defeat Tim Sprayberry.
Senate President Pro Tem, Del Marsh, R-Anniston, was third in the Senate with $58.01 for his votes.
In the race between life-long Republican Rep. Jim McClendon and party-switcher Sen. Jerry Fielding, for Senate District 11, Fielding out spent McClendon by around seven dollars per vote, however, McClendon bested his opponent by almost 60 percent. (Marsh and the Senate machine had back Fielding in the champaign, even the powerful farmers federation ALFA —under the direction of former Secretary of State Beth Chapman—funded Fielding’s losing campaign.)
Several incumbent House members, who received huge support from Hubbard, and former Gov. Bob Riley, saw their candidacies go down in flames, to insurgent conservative Republicans. Even though most incumbent out spent their opponents—with the support and financial resources of the Hubbard/Riley machine—they still lost.
Incumbent Rep. Wayne Johnson spend $71.54 per vote against challenger Ritchie Whorton’s $18.24 per vote, only to see Whorton beat Johnson with a 58.36 to 48.13 percent margin.
Likewise new comer Connie Rowe who spent only $7.53 per vote, to defeated incumbent Rep. Bill Roberts who paid $34.08 for each vote.
Incumbent Rep. Richard Baughn went down to defeat to Tim Wadsworth, even though Baughn paid $34.32 per vote while Wadsworth spent merely $12 for his.
The same was true for incumbent Rep. Kurt Wallace, who paid out $28 per vote only to be unseated by Jimmy Martin who spent $18.72 on each vote cast for him.
Other notable losses for Speaker Hubbard’s candidates was Charles Newton who paid $55 per vote to winner Chris Sells’ $63.19. And Randy Price (open seat Hubbard pick) who paid $60.19 for each vote to Isaac Whorton who only spent $13.38 to win the District.
Average House: $101.02
Average Senate: $46.98
Top 10 Big Spenders Senate price per vote
District 27—Tom Whatley $72.92 (53.14 percent), Andy Carter $1.09 (46.86 percent)
District 13—Gerald Dial $64.11 (51.50 percent), Tim Sprayberry $10.40 (48.50 percent)
District 12—Del Marsh $58.01 (59.99 percent), Steven Guede $10.11 (40.01 percent)
District 11—Jerry Fielding $50.03 (37.34 percent), Jim McClendon $42.84 (62.66 percent)
District 11—Jim McClendon $42.84 (62.66 percent), Jerry Fielding $50.03 (37.34 percent)
District 1—Tim Melson $39.18 (39.79 percent), Jonathan Berryhill $22.00 (23.58 percent)
District 8—Steve Livingston $39.10 (55.61 percent), Todd Greeson $35.13 (44.39 percent)
District 30—Harris Garner $36.14 (31.99 percent), Clyde Chamblis $32.35 (49.90 percent), Suzelle Josey $11.11 (11.44 percent)
District 8—Todd Greeson $35.13 (44.39 percent), Steve Livingston $39.10 (55.61 percent)
District 30—Clyde Chambliss $32.35 (49.90 percent), Harris Garner $36.14 (31.99 percent), Suzelle Josey $11.11 (11.44 percent)
Top 10 Big Spenders House price per vote
District 79—Mike Hubbard $304.28 (60.20 percent), Fred “Sandy Toomer $145.28 (39.80 percent)
District 79—Fred “Sandy Toomer $145.28 (39.80 percent), Mike Hubbard $304.28 (60.20 percent)
District 80—Lesley Vance $103.54 (64.35 percent), Melvin Dudley $35.86 (17.16 percent)
District 43—Doug Clark $76.24 (19.40 percent), John Bahakel $5.88 (6.78 percent),
Cheryl Ciamarra $25.24 (11.42 percent), Gina McDonald $17.09 (2.76 percent), Arnold Mooney $42.89 (30.08 percent), Don Murphy $26.33 (6.93 percent), Amie Beth Shaver $41.17 (22.63 percent)
District 22—Wayne Johnson $71.54 (41.64 percent), Ritchie Whorton $18.24 (58.36 percent)
District 91—Barry Moore $63.83 (55.46 percent), Joshua Pipkin $2.85 (44.54 percent)
District 90—Chris Sells $63.19 (51.10 percent), Charles Newton $55.18 (48.90 percent)
District 47—David Wheeler $62.17 (39.75 percent), Jack Williams
District 38—Randy Price $60.19 (43.55 percent), Isaac Whorton $13.38 (56.45 percent)
District 46—Steve French 59.97 (26.29 percent), David Faulkner $29.51 (45.39 percent), Pamela Blackmore-Jenkins $19.36 (4.90 percent), Justin Barkley $12.86 (23.42 percent)
Incumbents that out spent opponents and still lost
HD 22—Wayne Johnson $71.54 (41.64 percent), Ritchie Whorton $18.24 (58.36 percent)
HD 13—Bill Roberts $34.08 (48.13 percent), Connie Rowe $7.53 (51.87 percent)
HD 14—Richard Baughn $34.32 (49.64 percent), Tim Wadsworth $12 (50.36 percent)
Charles Newton $55 (48.90 percent), Chris Sells $63.19 (51.10 percent)
HD 38—Randy Price (open seat Hubbard pick) $60.19 (43.55 percent), Isaac Whorton $13.38 (56.45 percent)
HD 42—Kurt Wallace $28 (49.36 percent), Jimmy Martin $18.72 (50.64 percent)
SD 11—Jerry Fielding $50.03 (37.34 percent), Jim McClendon $42.84 (62.66 percent)
Challengers that out spent incumbents and still lost—House
HD35—Steve Dean $53.40 (39.52 percent), Steve Hurst (I) $26.95 (60.48 percent)
Challengers that out spent winners and still lost—Senate
SD2—George Barry $28.46 (34.01 percent), Bill Holtzclaw (I) $26.52 (65.99 percent)

